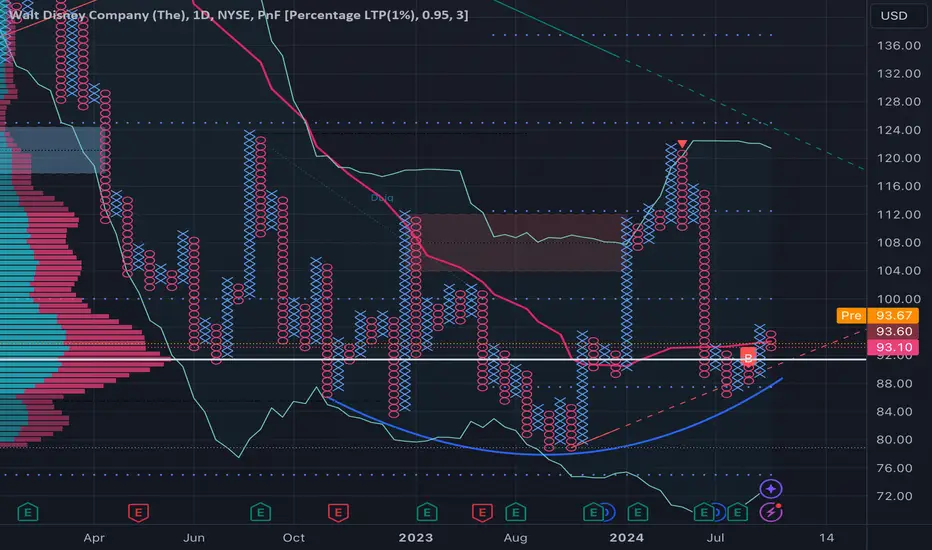
DIS reversalPotential reversal long term downtrend. Higher high and low, buy above recent x
Target prior high and volume spike 110-112
AVGO Broadcom Options Ahead of EarningsIf you haven`t bought the dip on AVGO:
Now analyzing the options chain and the chart patterns of AVGO Broadcom prior to the earnings report this week,
I would consider purchasing the 170usd strike price Calls with
an expiration date of 2025-1-17,
for a premium of approximately $13.70.
If these options prove to be profitable prior to the earnings release, I would sell at least half of them.

UNFI United Natural Foods Options Ahead of EarningsAnalyzing the options chain and the chart patterns of UNFI United Natural Foods prior to the earnings report this week,
I would consider purchasing the 17usd strike price Calls with
an expiration date of 2024-10-18,
for a premium of approximately $1.25.
If these options prove to be profitable prior to the earnings release, I would sell at least half of them.

LW Lamb Weston Holdings Options Ahead of EarningsIf you haven`t sold LW before the previous earnings:
Now analyzing the options chain and the chart patterns of LW Lamb Weston Holdings prior to the earnings report this week,
I would consider purchasing the 65usd strike price Calls with
an expiration date of 2024-10-18,
for a premium of approximately $5.15.
If these options prove to be profitable prior to the earnings release, I would sell at least half of them.

STZ Constellation Brands Options Ahead of EarningsAnalyzing the options chain and the chart patterns of STZ Constellation Brands prior to the earnings report this week,
I would consider purchasing the 240usd strike price Puts with
an expiration date of 2024-10-18,
for a premium of approximately $0.90.
If these options prove to be profitable prior to the earnings release, I would sell at least half of them.

SHOP Pnf wedge breakoutPnf buy signal breaking out of wedge in uptrend. Buy Nov85/95 bull call spread
Target 105, will look to add/pyramid on pullbacks


TSLA Robotaxi “one for the history books” - Elon MuskIf you haven`t bought the dip on TSLA:
Now you need to know that Tesla’s Robotaxi unveiling is generating excitement with its “We, Robot” tagline, a clear signal that the automaker is about to unveil something groundbreaking, potentially bigger than what was imagined in the sci-fi classic I, Robot.
Tesla began sent exclusive invitations to retail investors, influencers, and owners, fueling anticipation around its latest innovation—the Cybercab. Drawing from the attention-grabbing design of the Cybertruck, the Cybercab could mark a significant leap forward in autonomous transportation.
Elon Musk called the event “one for the history books” in a post on X, further boosting speculation about what this could mean for Tesla's future. With heightened interest in the Warner Bros. Studio event in Burbank, California, the buzz surrounding Tesla’s Robotaxi unveiling could signal strong momentum for TSLA stock, as investors anticipate the potential long-term impact of this revolutionary technology.

CLSK most important chart and targets! (NFA)Hello Tradingview community!
As always: If this pattern I'm showcasing doesn't work as predicted..
then please don't come crying to me (ty) -> NFA DYOR
I think from a chart perspective this is our MOST important chart for NASDAQ:CLSK
As you can see.. these "channels" got respected all the way up and down
What are the targets? Well I have highlighted some for you on the charts -
but honestly these prices can change a lot since it depends on when
CLSK hits those lines... So stick to watching the lines and not the
highlighted prices I've put onto the chart.
What do I personally think will happen?
Well i believe we either go in the short term down to 7.5-8 dollars OR
we recover here and 10 dollars is coming soon.
How about EOY?
Well because i'm fairly bullish on CLSK and the chart shows it's possible
I believe CLSK will be 14 dollars to even 20+ (lines on the chart)
How about 2025?
Well again, from my personal perspective i believe CLSK could be
Q1-Q2 2025: 30-40 dollars and potentially Q3-4 2025: 50+ dollars
Of course -> NFA DYOR it's very important you WATCH the lines
and don't just follow hopium.

JPM JPMorgan Chase Options Ahead of EarningsIf you haven`t bought the dip on JPM:
Now analyzing the options chain and the chart patterns of JPM JPMorgan Chase prior to the earnings report this week,
I would consider purchasing the 210usd strike price Puts with
an expiration date of 2024-10-18,
for a premium of approximately $2.82.
If these options prove to be profitable prior to the earnings release, I would sell at least half of them.

80% gains AMD/NVDA Pairs Trade: Best Level to BUY/HOLD AMD🔸Hello traders, today let's review 4hour price chart for AMD.
Price structure is bullish inverted H*S setup with reload zone bulls
near 150 usd, currently expecting rejection near overhead resistance.
🔸AMD is trailing behind NVDA so far this year, YTD gains of 17%, NVDA
YTD gains at 167%. AMD is trailing behind NVDA massively and expecting
mean reversion / catch up trade later in 2025. AMD market cap sits
at 250 bln USD so it's an easy double from here. Fair value for AMD
is 500 bln USD, NVDA is valued at 3 T right now, which is massive.
🔸Recommended strategy bulls: Bulls wait for rejection from overhead resistance to confirm IHS setup / near 175 usd and wait for pullback/correction into mirror S/R level at 150/155 USD. BUY/HOLD setup, SL fixed at 125 USD TP1 is 250 USD TP2 is 300 USD in 2025. This is a swing trade setup with 80%+ upside potential, naturally more patience required to hit targets.
🎁Please hit the like button and
🎁Leave a comment to support our team!
RISK DISCLAIMER:
Trading Futures , Forex, CFDs and Stocks involves a risk of loss.
Please consider carefully if such trading is appropriate for you.
Past performance is not indicative of future results.
Always limit your leverage and use tight stop loss.

Delta Air Lines (NYSE: $DAL) Set to Report Q3 Earnings Today As Delta Air Lines (NYSE: NYSE:DAL ) prepares to report its Q3 earnings on October 10, 2024, investors are keenly watching for signs of a potential breakout. Despite facing industry-wide challenges, including rising costs and the looming impact of Hurricane Milton, Delta stock ( NYSE:DAL ) is showing signs of bullish momentum. With analysts predicting a 25% earnings decline to $1.52 per share, the Atlanta-based airline still has promising revenue growth forecasts, as the airline sector continues to rebound.
Earnings Outlook
For Q3, analysts expect Delta’s earnings to decline 25% year-over-year, largely due to higher operating costs and fare competition caused by an oversupply of flights but that's too bad. However, revenue is expected to inch up by 0.7%, reaching $15.595 billion, thanks to steady travel demand at least some hopium. The outlook for Delta’s full-year earnings suggests a slight dip to $6.18 per share, which is within the airline’s guidance range of $6-$7 per share. Notably, analysts project a strong 19% rebound in earnings for 2025, raising optimism for long-term investors.
Revenue Hit from IT Outage:
This earnings report will be Delta’s first since the massive IT outage in July caused by a CrowdStrike software update. The outage forced the airline to cancel thousands of flights, resulting in a $500 million revenue hit. While the company has considered legal action against the software provider, the incident has cast a shadow over its Q3 performance. ugh With all this, i don't think NYSE:DAL stock could escape the plunge.
Hurricane Milton's Impact:
The imminent arrival of Hurricane Milton, a Category 4 storm, poses an additional threat to Delta’s Q3 results. On Wednesday alone, over 2,500 flights were canceled, many of which belonged to Delta. The company is bracing for further disruptions as the hurricane hits Florida’s west coast. This comes on the heels of Hurricane Helene, which wreaked havoc across the Southeast earlier in the month.
Despite these headwinds, Delta’s leadership in the airline industry remains solid. As one of the most profitable U.S. carriers, Delta is expected to weather these short-term challenges and emerge stronger, especially as the entire travel sector, including cruise lines and hotels, rebounds aggressively into 2025.
Technical Analysis:
On the technical front, Delta stock is approaching a key buy point at $52.45, which represents a cup-with-handle formation. The stock has been in a rally mode, following a 6% gap-up in late September, when Southwest Airlines raised its revenue guidance and lowered fuel cost projections. Since then, Delta stock (NYSE: NYSE:DAL ) has gained nearly 2%, closing just shy of the crucial buy point on Wednesday.
Bullish RSI and Inverted Hammer Signal Potential Breakout:
As of Wednesday’s close, Delta stock (NYSE: NYSE:DAL ) exhibited a bullish RSI of 67.24, suggesting strong momentum. Additionally, the daily price chart revealed a bullish inverted hammer candlestick, a pattern often indicative of a potential reversal to the upside. A breakout above $52.45 could pave the way for a move toward the pivot point at $54, marking a bullish trajectory for the stock.
However, traders should also keep a close eye on the downside. A break below the one-month low of $46 could trigger a selling spree, especially if the hurricane impacts the company more severely than expected.
Broader Sector Rebound: A Positive Tailwind
While Delta faces (NYSE: NYSE:DAL ) its own unique challenges, the broader airline sector has been rallying for nine straight weeks. United Airlines ( NASDAQ:UAL ) and Southwest Airlines ( NYSE:LUV ), which are set to report earnings later this month, have both been climbing in tandem. The entire travel sector, buoyed by strong demand for both leisure and business travel, continues to outperform, with analysts predicting further gains through 2025.
In addition to the airline industry, cruise lines like Royal Caribbean ( NYSE:RCL ) and travel booking platforms have seen robust growth, with Citi analysts noting that the rally “has real legs” into 2025. For Delta, this sector-wide recovery could provide further support for its stock price, despite near-term turbulence.
Price Target and Analyst Sentiment:
Delta stock (NYSE: NYSE:DAL ) is currently trading around $47.90, down 6.5% in premarket trading on Thursday. Analysts remain optimistic about the stock’s long-term prospects, with a consensus price target of $61.89, implying a 21% upside from Wednesday’s close. Additionally, 11 analysts have assigned Delta a "Strong Buy" rating, further bolstering the bullish sentiment surrounding the stock.
Conclusion:
Delta Air Lines (NYSE: NYSE:DAL ) is at a critical juncture as it prepares to report Q3 earnings. Despite the challenges posed by Hurricane Milton, rising costs, and the recent IT outage, Delta’s fundamentals remain strong. The airline is expected to see a modest revenue increase in Q3, with significant earnings growth projected for next year. Technically, the stock is on the cusp of a potential breakout, and a move above $52.45 could trigger a fresh rally. However, investors should remain cautious, as a dip below $46 could lead to a sell-off.

WFC Wells Fargo & Company Options Ahead of EarningsIf you haven`t bought the dip on WFC:
Now analyzing the options chain and the chart patterns of WFC Wells Fargo & Company prior to the earnings report this week,
I would consider purchasing the 51usd strike price Puts with
an expiration date of 2024-11-1,
for a premium of approximately $0.24.
If these options prove to be profitable prior to the earnings release, I would sell at least half of them.

BLK BlackRock Options Ahead of EarningsIf you haven`t bought the dip on BLK:
www.tradingview.com
Now analyzing the options chain and the chart patterns of BLK BlackRock prior to the earnings report this week,
I would consider purchasing the 860usd strike price Puts with
an expiration date of 2025-1-17,
for a premium of approximately $12.25.
If these options prove to be profitable prior to the earnings release, I would sell at least half of them.

Amazon H4 for entriesAmazon H4 chart is giving us entry point,am also doing this for new traders n people's whose struggling to find entries use this chance to position yourselfs,there is no need to give you this n entries
,you need to just see graph n knowing what to do in feature,I can explain wrong thing n see market going opposite direction soo what is matter is what you do after you see analysis or do your own if it match what you see, you know what to do.

FUTU"S REVERSAL The stock is expected to retrace into that fib levels then decisions willl be made after then

A Royal Breakout for Royal #Gold $RGLDExpect a royal breakout. Upside target at least $200. That is at least 40% from top range. Probably could happen after presidential election.
NASDAQ:RGLD

Can the MAGNIFICENT 7 outperform once more?We have seen the Magnificent 7 (Apple, Microsoft, Google, Amazon, Nvdia, Meta, Tesla) underperform historically but since the start of the year this hasn't been as strong as previously (roughly +35% for M7 against + 25% for Nasdaq). The former can be seen on the left chart while the latter on the right. This goes so far against the aggressive nature of the Magnificent 7 (M7), which have outperformed Nasdaq on all previous rallied by around +50%.
In fact the M7's first major rally (2016 - 2018) rose by +140% while NDX's by +97%. The second major rally (2019 - 2021) registered +315% for MA7 and 'just' +185% for NDX. If there is any progression between them, we can argue that the current rallies will be even stronger. Of course the sample isn't big enough for solid conclusions and multi-year rallies can't keep getting stronger on each Cycle for ever.
What is reasonable to count on however, is that as the Fed stepped in recently and gave the market the first Rate Cut in years, a new Cycle of cheap money to invest with has started and we can expect rallies of equal strength with the previous ones. For M7 (+315%) that's $440, so around +60% from the current levels, while for Nasdaq (+185%) that's 30000, so around +47% from the current levels. Not an incredible difference considering the risk that highly volatile stocks like the M7 bear. This could be a sign that the market is shifting to other stocks during this Cycle and the M7 potential may be fading.
In any event, do you think the Magnificent 7 will start to outperform Nasdaq again and if so is this worth the risk than investing your capital on the 100 companies of the index?
-------------------------------------------------------------------------------
** Please LIKE 👍, FOLLOW ✅, SHARE 🙌 and COMMENT ✍ if you enjoy this idea! Also share your ideas and charts in the comments section below! This is best way to keep it relevant, support us, keep the content here free and allow the idea to reach as many people as possible. **
-------------------------------------------------------------------------------
💸💸💸💸💸💸
👇 👇 👇 👇 👇 👇

RISE OF PAYPAL Paypal has been consolidating for like a year or two , so we will be expecting paypal to retrace back to 80k per shares for looking for another buy

Florida HurricaneThe market gapped down and invalidated this option but the idea is still good and I've decided to publish it.

MSFT Bounce at 100EMA with Bullish bar - Careful of Earnings Many people think earnings period for stock is not the time to trade. But what I learn is opposite... earnings with manipulation candlestick is very potent.... Lets put this theory to the test... Buying 99 Days calls with $3 as max loss ( nothing to worry about)

PROCTER & GAMBLE Low risk buy opportunity on the Channel bottom.Procter and Gamble (PG) has been trading within a 10-month Channel Up (since December 15 2023) and on September 10 2024 priced the latest Higher High and got rejected. Even though it has broken below its 1D MA50 (blue trend-line), yesterday it tested and held the short-term Support 1 level, which is intact since August 14.
The 1D MA200 (orange trend-line) has been the absolute Support of this pattern, having formed just above it both the Higher Lows of July 30 and April 19. Yesterday's Low isn't as close to the 1D MA200 as those two but it is close enough to constitute a low risk buy for the medium-term, even though we might see a little more decline towards the Channel's bottom. Notice however the 1D RSI that made a clear rebound inside its 10-month Buy Zone.
As a result, we turn bullish on this stock and as with the last Higher High, we are again targeting the 1.5 Fibonacci extension level at 182.00.
-------------------------------------------------------------------------------
** Please LIKE 👍, FOLLOW ✅, SHARE 🙌 and COMMENT ✍ if you enjoy this idea! Also share your ideas and charts in the comments section below! This is best way to keep it relevant, support us, keep the content here free and allow the idea to reach as many people as possible. **
-------------------------------------------------------------------------------
💸💸💸💸💸💸
👇 👇 👇 👇 👇 👇
