
MSFT long @ 417.13 for a quick bumpIt's oversold (according to my algo so please don't waste your time with telling me it's nowhere near oversold). It's in what I'd call a consolidation phase after more than doubling in the last 22 months. Unless there is a total macro meltdown, I don't see it having any good reason to (at worst) fall below the August 395 level and to do so would require to to breach the blue trend line as well as support from the early September low. I just don't see that happening soon.
That said, I'm a short term trader and with it being oversold, Im looking for a quick move higher in the next few days. Nothing amazing, I don't think, but enough to make me a quick buck or two. Maybe testing that upper blue resistance line.
Longer term, I'd give MSFT "core holding" status alongside NVDA as a major player in AI. NVDA from the hardware side, but MSFT in what I think will turn out to be the more lucrative side - applications. MSFT has a nearly endless number of potential applications for AI and are investing heavily in it, for both themselves and to provide services for customers down the road.
I'd get bearish if it broke down below 395, but if that happens, I really think there will be nowhere to hide in the market. Obviously if it breaks the upper blue resistance line, I see 465-470 ATH as its next test. I think short term it tests the blue support trend line and bounces. That's what I'm here for.

PBR.A goes up from here.PBR and PBR.A is set up to retake the previous highs as Oil continues its rise. Shocks to global supply are imminent. New discoveries give the company plenty of room to continue to increase production and global share well into the future. Political risk baked in. Max pain 12.50-11.50. Stop set at 12.76. PT $17/Share.

Trump Media & Technology Group Stock Surges as Musk Backs TrumpShares of Trump Media & Technology Group (NASDAQ: NASDAQ:DJT ) surged by over 15% on Monday, buoyed by renewed political momentum after former President Donald Trump’s rally in Butler, Pennsylvania, where he appeared alongside Tesla CEO Elon Musk. The event, held just a day prior, saw Musk publicly endorse Trump for president, a move that has energized Trump’s supporters and investors alike. Musk’s endorsement, along with the rally’s broader media coverage, has acted as a significant catalyst for NASDAQ:DJT stock, which has seen a strong uptick in trading volume and investor interest.
Musk-Backed Momentum and Media Buzz
The rally in Butler marked a high-profile return for Trump to the site of a previous assassination attempt in July, with Musk's appearance further amplifying the media attention. In his 90-minute speech, Trump spoke at length about his vision for the country, while Musk labeled himself “Dark MAGA” and expressed strong support for Trump’s re-election, stating, “President Trump must win to preserve the Constitution.” This public backing by one of the world's most influential tech entrepreneurs has provided a jolt to NASDAQ:DJT , which had previously been on a steady decline.
Adding to this momentum is the recent U.S. Supreme Court dismissal of a lawsuit filed by Musk’s X Corp. The lawsuit alleged that Special Counsel Jack Smith violated the First Amendment in obtaining a search warrant for Trump's communications on Twitter. The dismissal was seen as a victory for both Trump Media and Musk, helping to restore some investor confidence.
However, challenges remain. Trump Media recently revealed in regulatory filings that its Chief Operating Officer, Andrew Northwall, resigned in late September, marking yet another leadership shake-up within the company. Additionally, the firm is set to release nearly 800,000 shares of its stock to an early investor, per a Delaware judge’s ruling. Despite these internal challenges, the company’s chief product, Truth Social, continues to depend heavily on Trump’s popularity and his continued presence on the platform.
Technical Outlook
Technically, NASDAQ:DJT appears to be in the early stages of a potential bullish rebound. The stock is currently up 10.67% as of this writing, capitalizing on the rally’s momentum and Musk’s endorsement. However, NASDAQ:DJT has been in a falling trend pattern since its all-time high (ATH) back in March 2024, signaling a long-term downward trend.
The Relative Strength Index (RSI) stands at 54.54, indicating that the stock is not yet overbought and has room to grow further. This gives traders optimism that the stock could continue its upward trajectory. A key concern, however, is that NASDAQ:DJT is still trading below critical moving averages (MAs), particularly the 50-day and 200-day MAs. These levels represent important resistance points that NASDAQ:DJT will need to break through to confirm a sustained bullish reversal.
Price targets suggest that the next major pivot for the stock is set at $33, aligning with the 200-day MA. Should NASDAQ:DJT continue to capitalize on its recent gains, breaking through this level would be a strong indicator of further upward movement. However, until the stock moves above these key averages, caution is warranted as NASDAQ:DJT remains vulnerable to retracement.
Outlook: Political Tailwinds Could Drive Future Gains
The rally in Butler, Musk’s endorsement, and recent legal victories have given NASDAQ:DJT a fresh boost of momentum, but the stock still has significant hurdles to overcome. Investors are eyeing the upcoming 2024 election cycle as a potential catalyst for further gains, particularly if Trump’s popularity continues to rise.
While the stock is still trading below its key moving averages, the formation of a bullish pattern and steady RSI suggest that there may be room for further upside. As NASDAQ:DJT recovers from its post-March lows, long-term investors and traders will be watching closely to see if the stock can break through the $33 resistance level, which could signal a full-blown reversal of its current trend.
For now, NASDAQ:DJT is riding a wave of political and media momentum, and the road ahead is one of cautious optimism. Investors would do well to keep an eye on both Trump’s political fortunes and the company’s internal management developments as key factors that will influence the stock’s trajectory.

Randomly entered the MSI upwards trendA few days ago, I entered a long position in $MSI. The sideways correction that lasted most of September seems to have been broken. The upward impulse was followed by a correction over the last few trading days, making it appear to be a good position to enter the trade.
The bullish trend has been ongoing for several months, with the SMAs beautifully aligned. I expect bullish action in October, before some instability may arise in the market with the upcoming earnings report for NYSE:MSI , the presidential election, and the FED announcement.

Long order placed in CalixI see a strong likelihood that the price will initiate its next bullish move from this point. After the previous upward movement, the price corrected downwards over a period of 8 trading days, found support at the 30-day SMA, and formed a hammer candle on the last trading day.

Small/mediam cap stocks profit more from lower interest rates?See chart attached. Speculative long order placed. Let's the if the last highs get broken (and with it also the SMA 50 ). Then I expect also that some gaps in this chart are getting filled. ;)

OReilly Long!I've entered a long position in $ORLY. Since this US stock reached its high in late July of this year, it has been continuously in a sideways correction, which is very bullish. In the last few trading days, it broke out of this channel to the upside and re-tested it on the last trading day.
The price is currently supported by the 38.2% Fibonacci level, the upper boundary of the broken channel, and the moving averages are catching up.
Let's see if this setup plays out as expected.

Coca Cola - A Clear Trading Setup!Coca Cola ( NYSE:KO ) will provide a textbook setup soon:
Click chart above to see the detailed analysis👆🏻
Coca Cola is one of these "under the radar" stocks which is just trending higher and higher but nobody is really paying attention. However currently Coca Cola is retesting a resistance trendline of the governing rising channel pattern so a short term retracement is quite likely.
Levels to watch: $72, $65
Keep your long term vision,
Philip (BasicTrading)

Microsoft - We Will See A Correction!Microsoft ( NASDAQ:MSFT ) can actually create a correction:
Click chart above to see the detailed analysis👆🏻
Microsoft is one of the strongest stocks over the past decade and also over the past couple of months, there was no clear sign of weakness. Therefore, it is actually not extremely likely that a correction will happen, but if it does, this will offer a long term texbook trading opportunity.
Levels to watch: $420, $350
Keep your long term vision,
Philip (BasicTrading)

PAGS high earnings yield, low book value, pressed on bollingers Going long a combination jan 2025 options spread and long stock.
I am bullish the stock over the 5 year outlook at current prices.
It could trade in a 6 to 14 range for a while before breaking out.
5 year out look price target could be 30-40 dollar stock at high multiple PE on stock.
Company is a payments company in brazil.
Earnings yield is very high, pe is very low. Forward 2025 PE is 6.60.
Price is near Tangible book value, at 6.54.
RISK-EWZ etf is showing possible risk to the downside, that could hurt PAGS.
------------------------------
following info credit to perplexity.ai
--------------------------------
PagSeguro Digital Ltd. (NYSE: PAGS) is a Brazilian fintech company that provides financial and payment solutions. Here's an overview of PAGS stock and the company:
## Company Overview
PagSeguro Digital offers a range of services including:
- Digital banking solutions
- Online and point-of-sale (POS) payment processing
- Debit, credit, and prepaid cards
- Credit products like loans and overdraft accounts
- Insurance and investment services
The company primarily serves consumers, individual entrepreneurs, micro-merchants, and small to medium-sized businesses in Brazil and internationally
## Analyst Outlook
The stock currently has a "Buy" rating from analysts, with an average 12-month price target of $15.11, representing a potential 71.51% increase from the current price .
## Recent Developments
PagSeguro has been showing strong growth in its core business:
- In Q2 2024, the company reported a 34% increase in Total Payment Volume (TPV) and a 31.7% year-over-year growth in net income .
- The company has been gaining market share and outpacing industry TPV growth, despite challenges from high interest rates in Brazil .
While PagSeguro faces competitive challenges in the Brazilian fintech market, its discounted valuation and growth potential have attracted attention from some investors looking for long-term opportunities in the sector

CLSK: 2 targets I'm watchingHello Tradingview community!
As always: If this pattern I'm showcasing doesn't work as predicted..
then please don't come crying to me (ty) -> NFA DYOR
Alright I'll make this message very short cause I don't have time to write a
whole book atm (sorry) -
the chart explains itself = If we keep riding this channel we could see
anything from low 6s (lowest part of channel) to the middle line at
8ish.. IF we break the channel though I'm expecting 12-13 dollars.
NFA DYOR
NASDAQ:CLSK

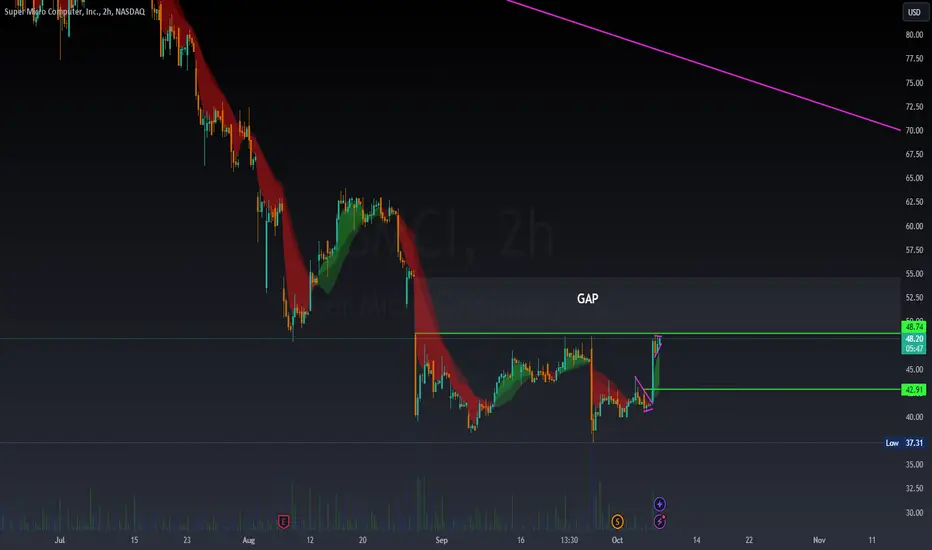
SMCI: Are we back in business??Super Micro Computer just broke over the LH 1 trendline holding since July 15th and is about to turn bullish again on the 1D technical outlook (RSI = 54.296, MACD = -2.380, ADX = 24.033). Coming off a double bottom (DB), the only resistance left before the bullish trend is resumed, is the 1D MA50 (untested since July 17th). The 1D RSI already made its breakout over its own R level. When the 1D MA50 breaks, target the LH2 trendline (TP = 78.00).
## If you like our free content follow our profile to get more daily ideas. ##
## Comments and likes are greatly appreciated. ##

Microsoft LONG MSFT is looking great to long here, good 4R:R.
There is a 4H rsi bullish divergence right on support this is supporting the bullish idea.
I am targeting the wick fills at
TP1 :420
TP2 :423
LAst TP 425
SL is 4H closure below red support line at 413. after It could wick fill below at 410 but this depends on the overall market.

Wulf Most important channel to watch!Hello Tradingview community!
As always: If this pattern I'm showcasing doesn't work as predicted..
then please don't come crying to me (ty) -> NFA DYOR
I had a more short-term chart posted for not long ago that sadly seems to
not be doing what I was expecting (not wrong yet tho)
This channel right here is what i'm watching now for the "larger picture"
It's a much more important channel overall.
I'm watching the 3.2-3.5 area for a good DCA/Buy
and im still expecting October to be 5-6 dollars
and EOY 8-12 dollars.
we shall see! ONLY IDEAS .
NFA DYOR

Super Micro Computer Stock up 16% Amidst AI DemandSuper Micro Computer Inc. (NASDAQ: NASDAQ:SMCI ) has recently been thrust back into the spotlight after announcing a surge in shipments of its advanced graphics processing units (GPUs). These GPUs, driven by the ongoing artificial intelligence (AI) revolution, are powering some of the largest AI factories globally. The company revealed that it has deployed over 100,000 GPUs utilizing its proprietary liquid cooling technology, designed to help AI data centers cut down on energy costs while improving operational performance. The news has given NASDAQ:SMCI a fresh momentum, with the stock soaring 16.37% as of Monday’s trading.
AI Boom Fueling Growth
The ongoing boom in AI is playing a pivotal role in NASDAQ:SMCI ’s resurgence. The company, which supplies critical server infrastructure used for AI model training, data storage, and large-scale cloud operations, has been a significant beneficiary of the rising demand for GPU-powered AI systems. Partnering with Nvidia (NVDA), NASDAQ:SMCI leverages Nvidia’s cutting-edge $30,000 chips to service the growing AI sector. The company's ability to deploy more than 100,000 GPUs per quarter could translate into billions of dollars in potential revenue.
Additionally, NASDAQ:SMCI 's latest innovation—its direct liquid cooling products—has opened new avenues for reducing the overall energy footprint of data centers. CEO Charles Liang noted that these solutions are already being adopted by "state-of-the-art" AI factories, further solidifying the company’s standing in the green technology landscape.
Despite this growth, NASDAQ:SMCI has faced its share of challenges. The company is currently about nine weeks behind on filing its annual report, citing ongoing assessments of its internal controls over financial reporting. Furthermore, a recent investigation by the Department of Justice, following allegations of accounting manipulation by Hindenburg Research, caused shares to drop 12% last month. Still, with AI demand continuing to fuel orders, NASDAQ:SMCI ’s fundamentals remain strong.
Technical Outlook: A Bullish Flag in the Making?
From a technical standpoint, NASDAQ:SMCI is showing signs of a potential rebound after weeks of decline. The stock's 16% jump on Monday suggests that investors are starting to recognize the company’s growth potential once again. Currently, NASDAQ:SMCI is trading within a presumed falling trend channel, but with the latest bullish momentum, it appears ready to break out of this bearish pattern.
One of the most encouraging signs on the daily price chart is the early formation of a bullish flag pattern, a signal typically associated with the continuation of an upward trend. The stock has also avoided hitting overbought or oversold territory, as reflected in the Relative Strength Index (RSI), which is primed for further gains.
However, NASDAQ:SMCI is still trading below key moving averages (MAs), which serves as a point of caution for traders. A sustained move above these MAs could indicate a more stable reversal, suggesting that the stock might migrate from its current bearish trend into a more balanced state.
Outlook: Hope in the Midst of Uncertainty
While the stock remains down by over 50% from its March highs, the recent surge and new product innovations offer a glimmer of hope. If NASDAQ:SMCI can clear its regulatory hurdles and capitalize on the ongoing demand for AI infrastructure, the stock may continue to rise. The combination of fundamental strength in AI growth and the promising technical setup offers a compelling case for long-term investors.
The next key for investors to watch will be NASDAQ:SMCI 's ability to regain ground above its moving averages, solidifying the bullish reversal. If the bullish flag pattern plays out, the stock could see further gains as AI demand and liquid cooling innovation continue to drive its growth.

META SELL++++ Meta is way overbought here on the daily chart and due a pullback. First target is $562.47 Second is $541.16 where we have strong support and a gap to be filled

PLTR: Watch out for these turning points! (D&W charts)PLTR broke through the resistance at $38 that we warned about in our last study, triggering another bullish continuation pattern. It has also broken through an important resistance on the weekly chart, which further reinforces the bullish bias.
Now we have to update the main turning points to keep an eye on over the next few days. The link to our previous study is below this post, as usual.
Daily Chart (Left):
Higher Highs and Higher Lows: The price structure on the daily chart shows a consistent pattern of higher highs and higher lows, suggesting strong bullish momentum. This pattern indicates that buyers are stepping in at higher levels after each retracement, maintaining the trend.
Support Levels: Immediate support is found around $38.30, which aligns with a previous minor resistance zone that was broken and turned into support. Below that, $36.05 remains a significant support level, as it is near tthe 21-day EMA, making this a double support area. PLTR needs to lose this key point in order to reverse the mid-term trend and trigger a sharper correction in the weekly chart. PLTR would need to lose the double support level seen on the daily chart is order to trigger a pullback.
Gap at $31.04 (D) + 21-Week EMA: These two key points would act as targetts if a sharper correction materializes. The gap at $31.04 seen on the daily chart could work as a magnet, attracting the price to lower levels, while the 21-week EMA is another reliable support level on the weekly chart.
Weekly Chart (Right):
Ascending Channel: PLTR has been trading within an ascending channel since mid-2023, respecting both the upper and lower trendlines. The price broke the upper boundary of this channel, indicating a potential acceleration of the bullish momentum towards its next target.
All-Time High Target: The all-time high for PLTR is around $45.00, and it is its next resistance level, meaning, it is our next target.
Conclusion:
PLTR’s bullish momentum is well-supported on both the daily and weekly charts. The price is maintaining a solid structure of higher highs and lows, with $36.05 acting as the nearest support and $41.00 as the immediate resistance. If the price manages to break through $41.00 convincingly, the all-time high at $45.00 could be tested. A sustained breakout above the ascending channel on the weekly chart would further confirm the continuation of the uptrend. Traders might consider waiting for a confirmed breakout above $41.00 or watching for a potential pullback to $36.05 as a safer entry point.
For more detailed technical analyses and insights like this, be sure to follow my account. Your support helps me continue providing valuable content to help you make informed trading decisions.
Remember, real trading is reactive, not predictive, so let's stay focused on the key points described above and only trade when there is confirmation.
“To anticipate the market is to gamble. To be patient and react only when the market gives the signal is to speculate.” — Jesse Lauriston Livermore
All the best,
Nathan.

10/7/24 - $celh - WTF is going on <$30- this position has been such a thorn in my side
- but i can't find a reason to dump my bags, instead i've been adding
- now sub 30x PE for nearly 30% growth CAGR w the expectations reset?
- are we about to find out something horrific here... or is NASDAQ:PEP gonna drop a stank bomb on the name during their CC... what gives??
- given how other discretionary is trading, this still *feels* to me like it's not stock-specific. look at NYSE:ELF as a good example, you'd almost think NASDAQ:CELH and NYSE:ELF are the same stonk. this market is really devoid of short-term logic. so better know what you own and have conviction to stomach the vol. almost feels like we're trading dog coins in this stonk market these dayz.
- gl to all. remember it's all fake. just a game. and we're price takers. have an edge, or fafo.
- i still like this one. could go lower. idk. but good value here.
V

bear call spread on HSY over earningsThe weekly chart looks like death. Monthly doesn't look a lot better for the bulls.
PLUS, this gap on a Monday? Bear gap and go?
AND you can get $1.25 credit? on a $10 spread for less than 40 days. I dig it

MSFT basic trend analysisWaiting for a confirmation on this short term uptrend. Once it starts rising from this level, this uptrend will be confirmed. In that case look for a short term target of $450 +

Top 5 Weekly Trade Ideas #1 - SNOW Bear FlagSNOW has been pretty choppy lately if you ask me, but I do see some opportunity if it finally moves off of this area it's been at since the last earnings dump.
Nice looking bear flag here on the 4hr. I like puts with a stop above the bear flag, you could also wait for a downside break for more confirmation to enter. First downside target would be the previous all time low around 110. Final target is the flag pole projected target. I chose 95 for a nice whole number, it's hard to pick a target when a stock is making new all time lows, so I'll just be looking to scale out on any drops and see if it can hit 95 if I enter the trade.
