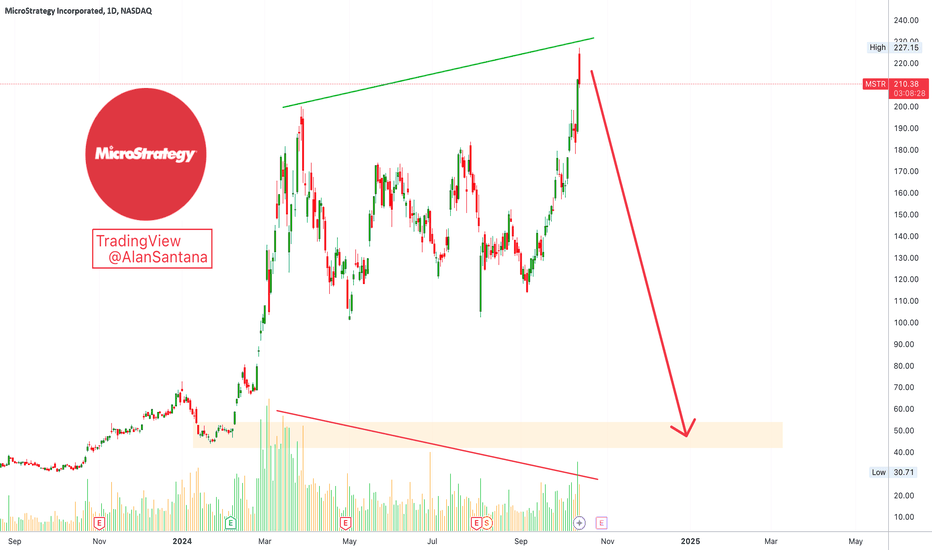
MicroStrategy Top Signal: Triple Bearish DivergenceThe MSTR stock just hit a new All-Time High and as soon as this happens the day turns full massive red. This action is indicative of a top. This is supported by a triple bearish divergence.
1) Volume bearish divergence. We see a new high happening today in price but a lower high on volume.
2) RSI bearish divergence. The RSI peaked in March 2024 and produced a lower high today, while MSTR produced a higher high. A very strong bearish divergence.
3) MACD bearish divergence. The MACD also peaked in March 2024.
These divergences are also present on the weekly timeframe.
➢ MicroStrategy Incorporated (MSTR) is about to experience the biggest correction since 2021.
Namaste.
Palantir Technologies Inc. (PLTR) All-Time High: Let Me Explain!You don't need to be a genius to figure this one out and you do not need any experience... This is an easy chart, let me explain.
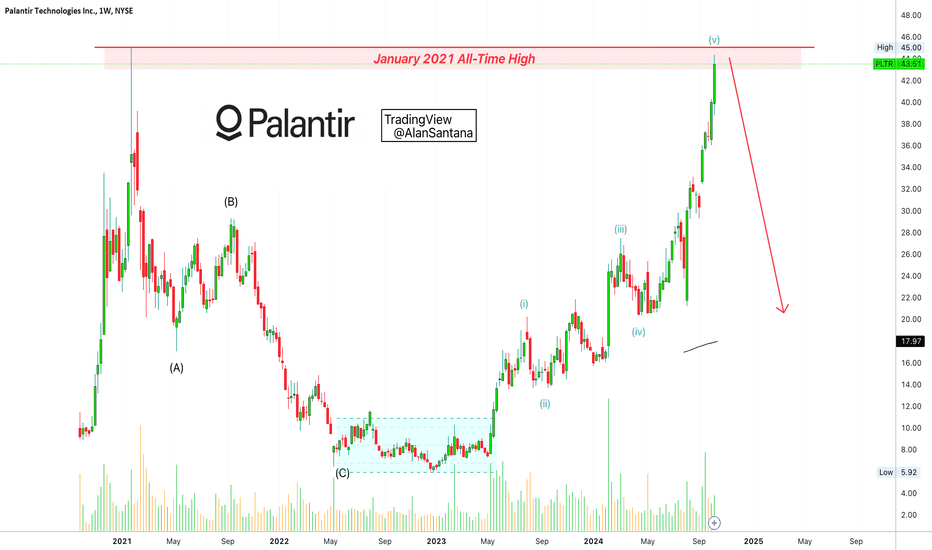
In January 2021 PLTR produced an All-Time High. As is usual and normal, after strong bullish action a correction follows.
The establishment of this All-Time High signaled the end of the bullish wave; the start of the bearish cycle.
We have the classic correction (ABC-Bear-market). This is followed by sideways action (blue channel) and then a new bullish wave (5-up wave pattern).
Palantir Technologies (PLTR) is still within the bullish impulse.
The highest volume happened February 2024. This is the third wave (the highest volume always comes on the third wave).
A higher high compared to February is happening now, there is high volume in September but lower than February. This is the fifth wave. The fifth wave signals the end of the bullish impulse.
Prices can go higher. There can be one, two, three weeks green and then a crash, or it can crash starting Monday. The fifth and final wave is the speculative wave so anything goes, but after the completion of this wave a crash comes.
We have a long-term lower high when we compared October 2024 vs January 2021.
A correction comes next, another ABC.
After the correction comes consolidation and then a new bull-market.
MA200 is the next and main support. That is, PLTR is moving toward 18.
Namaste.
COINBASE Enormous upside from this point. $360 minimum Target.Coinbase (COIN) has staged a strong bullish turnaround since our last analysis (September 09, see chart below) and it appears that we caught the perfect bottom buy:
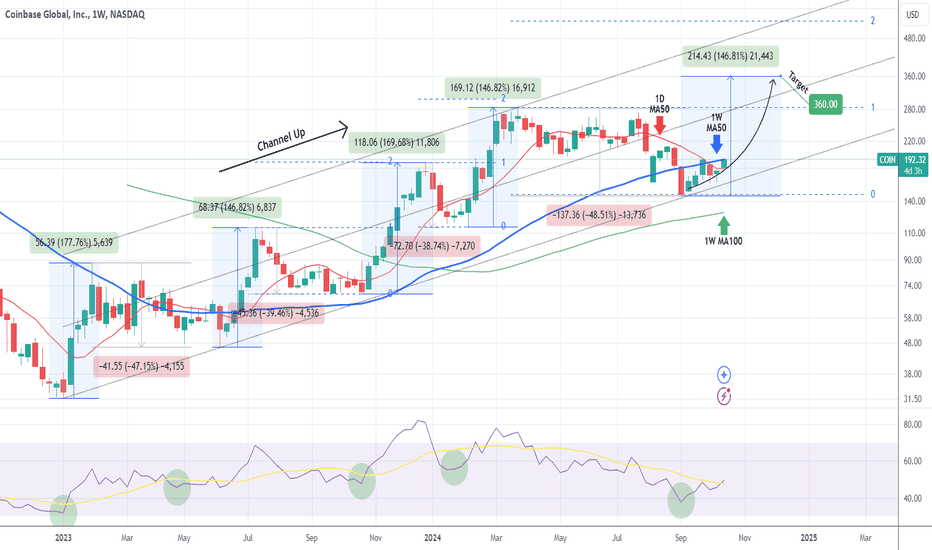
The stock has been trading within a long-term Channel Up since the first week of January 2023 (22 months). Within this time span, it has seen 4 corrections with the latter being the longest as we haven't seen a new High since the week of March 25 2024. The current correction is almost the same (-48.50%) as the January - April 2023 (-47.15%), while the other two have been around -39%.
The key for now is to close a 1W candle above both the 1W MA50 (blue trend-line) and the 1D MA50 (red trend-line). That will be the last confirmation for this Bullish Leg. This on its own is a very pessimistic development, with the presence of only the 1W MA100 (green trend-line) remaining to offer support long-term.
Now as for the upside, the minimum % rise of a Bullish Leg within this Channel Up has been +146.82% (two times). As a result, as long as the 1W RSI closes this week above its MA trend-line (yellow), a bullish signal that emerged on all previous 4 bottoms of the Channel, we can expect the new Bullish Leg to rise on a minimum +146.82% from its bottom, which gives us a $360.00 Target.
-------------------------------------------------------------------------------
** Please LIKE 👍, FOLLOW ✅, SHARE 🙌 and COMMENT ✍ if you enjoy this idea! Also share your ideas and charts in the comments section below! This is best way to keep it relevant, support us, keep the content here free and allow the idea to reach as many people as possible. **
-------------------------------------------------------------------------------
💸💸💸💸💸💸
👇 👇 👇 👇 👇 👇
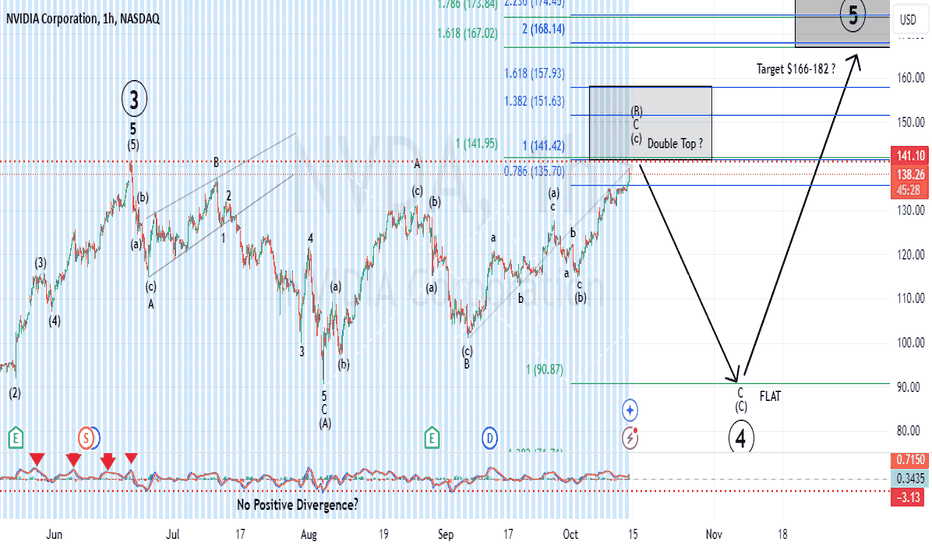
We're almost here!We are now just a point from my long held target of a double top, in what I am counting as an irregular (B) of intermediate degree.
Since price is behaving accordingly, I will not expand on what I have been forecasting for some time except to say that if shorting Nvidia in this area (as with any trade) make sure you are using stops...but best to wait for 5 micro waves down, followed by a micro corrective retace for the ideal set-up.
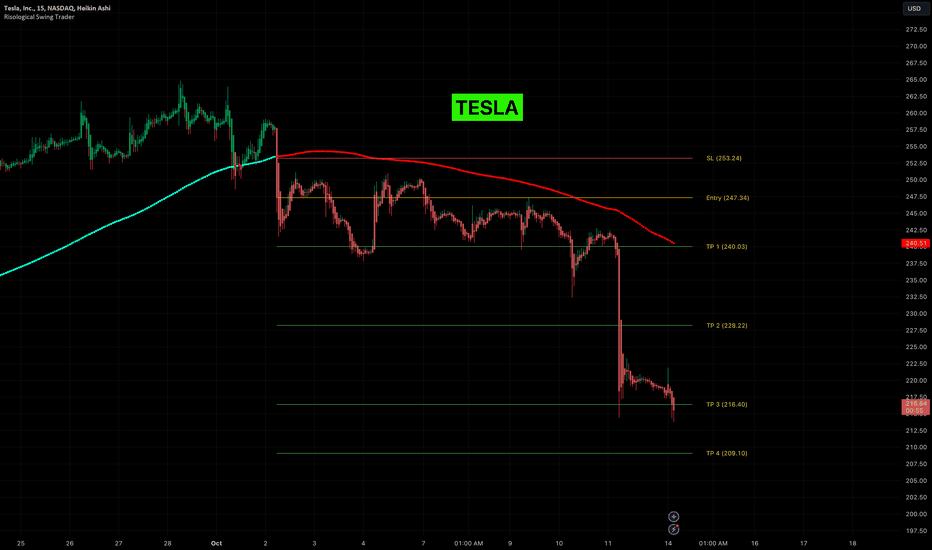
TESLA (TSLA) Plummets: Short Trade Hits Key TargetsTesla has shown a strong downward movement, breaking below key support levels. The entry point was established at 247.34, and since then, the price has declined rapidly, confirming the bearish momentum.
Key Levels
Entry: 247.34 – This level marked the beginning of the short trade as Tesla broke down below the Risological dotted trendline.
Stop-Loss (SL): 253.24 – Positioned slightly above the resistance formed by the recent highs, this level provides sufficient protection in case of a reversal.
Take Profit 1 (TP1): 240.03 – Already achieved, confirming the initial bearish move.
Take Profit 2 (TP2): 228.22 – The next level of profit where further downside pressure see sellers locking in profits.
Take Profit 3 (TP3): 216.40 – Tesla has reached this point, reflecting strong bearish momentum, possibly heading towards the final target.
Take Profit 4 (TP4): 209.10 – This is the final support level where the trade could conclude, given the sustained bearish sentiment.
Trend Analysis
Tesla has broken below both the Risological Dotted trendline (red line), indicating a solid downtrend.
The steep sell-off suggests the stock may continue its downward trajectory unless there is a strong reversal or news event that shifts market sentiment.
The bearish momentum is well in play for Tesla, and with TP3 already hit, the stock is moving towards the final profit target at 209.10
MOASS: How Will We Know Its OverSo far in our coverage of GME we have told you how high we think price will go during MOASS and also what technical triggers we think will lead to take off
We have also told you, from a timing perspective, when we think MOASS will kick into high gear (Oct 21st)
What we havent told you is how to know when MOASS is over
The short answer is: A break below VWAP
As we told you last week VWAP is a key data point that Institutions/Hedge Funds use to identify ideal entries/exits
Its also a key data point used to define acceptable risk (i.e. XYZ standard deviations from VWAP things break)
Like the Jan 21 squeeze this one will most likely be triggered by a Short Squeeze/ Gamma Ramp which will lead to forced buy-ins and extreme delta hedging
In a Short Squeeze/ Gamma Ramp environment VWAP is THE MOST IMPORTANT DATA POINT TO SHORTS
As long as price is ABOVE VWAP its not advantageous for them to close their positions...
And that is why your trigger to know that MOASS may be winding down is that first dip BELOW VWAP after price explodes
M O A S S
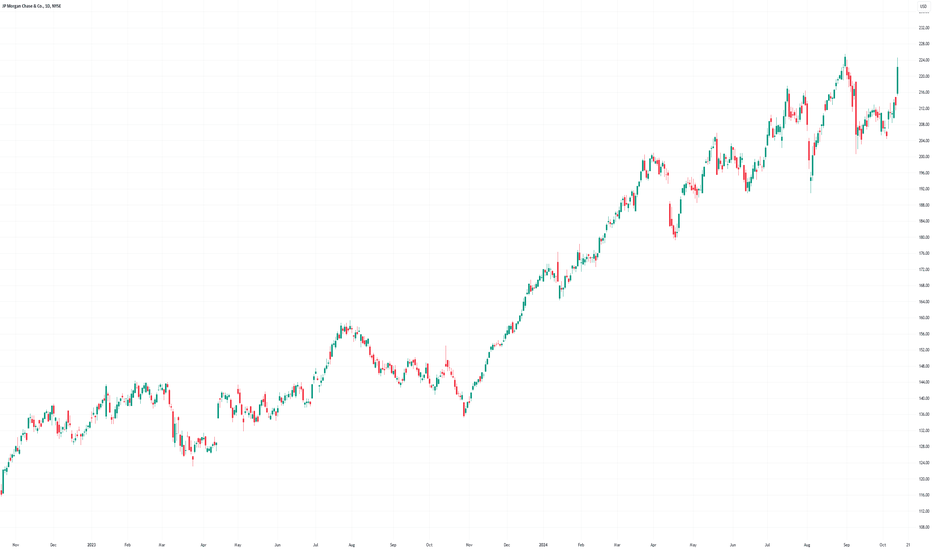
JPMorgan (JPM) Shares Rise Over 4% Following Earnings ReportJPMorgan (JPM) Shares Rise Over 4% Following Earnings Report
On Friday, before the market opened, JPMorgan (JPM) released its Q3 earnings, which exceeded expectations:
→ Earnings per share: Expected = $3.99, Actual = $4.97
→ Revenue: Expected = $41.4 billion, Actual = $43.4 billion
CEO Jamie Dimon praised the strong results but issued several cautionary statements. He noted:
→ Geopolitical risks are rising rapidly. "We have been closely monitoring the geopolitical situation for some time, and recent events show that conditions are dangerous and deteriorating."
→ "While inflation is easing and the US economy remains resilient, several critical challenges persist, including a large budget deficit, infrastructure needs, trade restructuring, and the remilitarisation of the world."
Despite Dimon's caution, investors responded positively to JPMorgan’s strong results, pushing JPM shares up more than 4% on Friday.
Year-to-date, the stock has gained around 30%, and since last October, the increase has been about 50%.
Technical Analysis of JPMorgan (JPM) Shares:
→ The price is moving within an ascending channel (shown in blue).
→ The RSI indicator has risen to the overbought zone.
→ Friday’s candlestick shows a noticeable upper shadow (a sign of selling pressure).
→ The psychological level of $225 per share may act as resistance, as seen at the start of September.
If the bullish momentum continues and the price of JPM shares approaches the upper boundary of the channel, this could set the stage for a correction, potentially towards the support zone formed by:
→ The lower boundary of the blue channel
→ Former resistance at $213
→ The lower edge of Friday’s bullish gap
According to TipRanks, the average analyst price target for JPMorgan shares is $228 over the next 12 months.
This article represents the opinion of the Companies operating under the FXOpen brand only. It is not to be construed as an offer, solicitation, or recommendation with respect to products and services provided by the Companies operating under the FXOpen brand, nor is it to be considered financial advice.
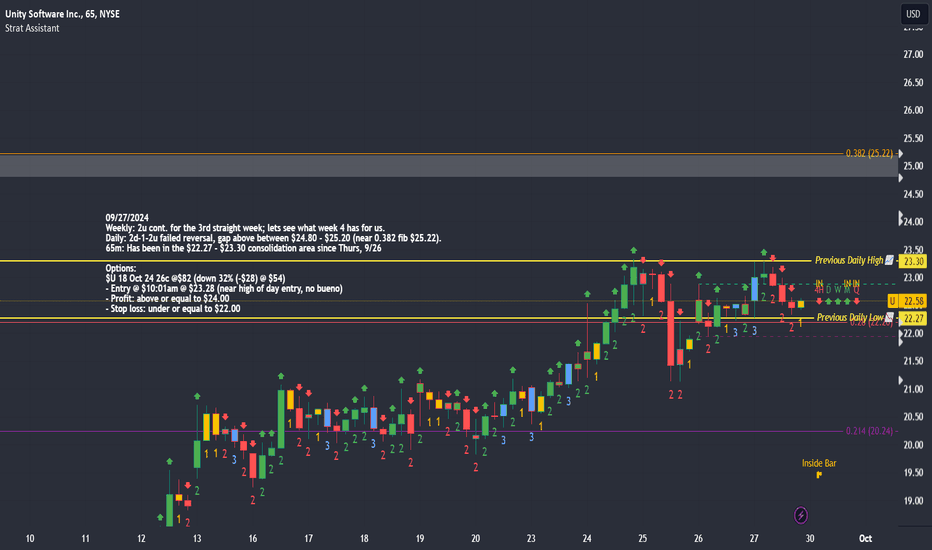
$U consolidating b/t $22.27 and $23.30, 65 minute09/27/2024
Weekly: 2u cont. for the 3rd straight week; lets see what week 4 has for us.
Daily: 2d-1-2u failed reversal, gap above between $24.80 - $25.20 (near 0.382 fib $25.22).
65m: Has been in the $22.27 - $23.30 consolidation area since Thurs, 9/26
Options:
NYSE:U 18 Oct 24 26c @$82 (currently down 32% (-$28) @ $54)
- Entry @ $10:01am @ $23.28 (near high of day entry, shouldn't of taken that trade)
- Profit: above or equal to $24.00
- Stop loss: under or equal to $22.00
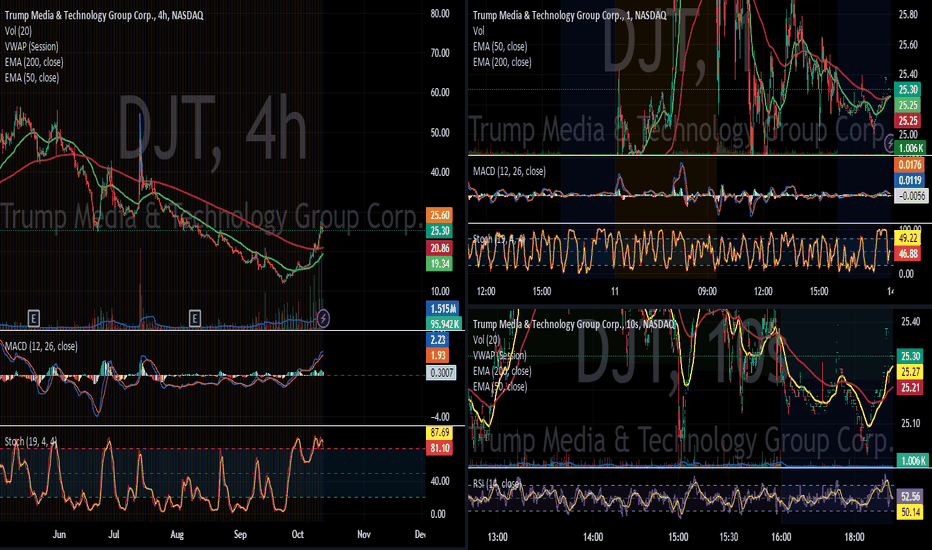
Why DJT Could Be Poised for a Breakout – Don’t Miss This Opp.!Here's Why DJT Could Be Ready to Climb:
If you check out the DJT daily chart, you'll notice it recently hit a year-to-date low, which is a significant support level. This is where the selling pressure seems to have reached its limit, and we’re starting to see signs of a turnaround. Momentum is picking up fast, and the overall sentiment around this stock is incredibly strong.
The positive buzz is coming from all angles, and while we may see some consolidation between $30 and $35 as traders lock in profits, the bigger picture looks promising. One major catalyst driving this is Elon Musk, who’s fully backing Donald Trump to win the election. Right now, polls show Trump with 56% support, and if he secures the win, we could witness DJT stock skyrocketing. A potential short squeeze might even push it to all-time highs as short-sellers scramble to cover their positions.
This is one of those rare opportunities to build real wealth during an election period. So, while the momentum is still building, consider taking a position and riding the wave. This could be your chance to capture some serious gains.
Don’t wait too long – be a part of this potential breakout!
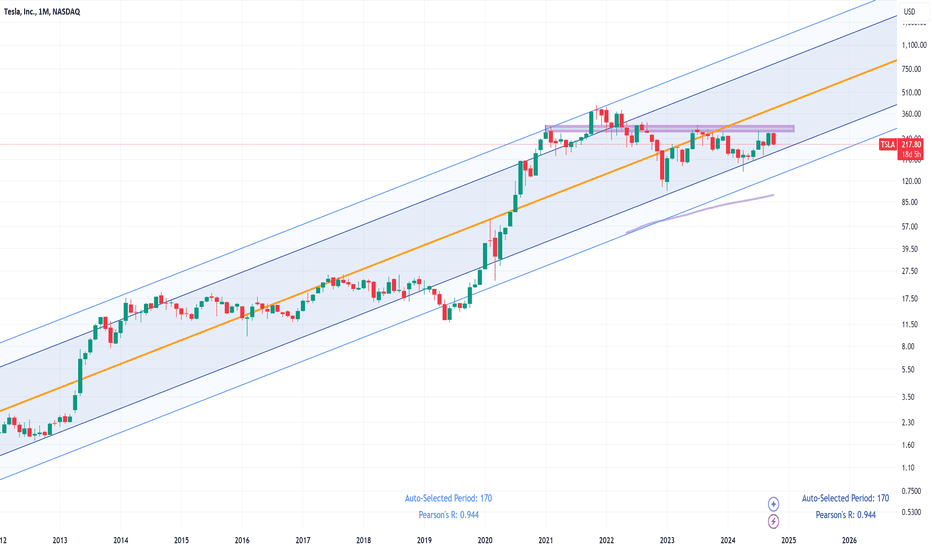
Those holding Tesla shares still need a lot of patience.Since the beginning of 2021, Tesla has been restricted by a resistance zone for upward movement, resulting in the price fluctuating within a range of monthly candles. However, the linear regression channel, which has been in place since 2011, will enforce a price increase within a few months.
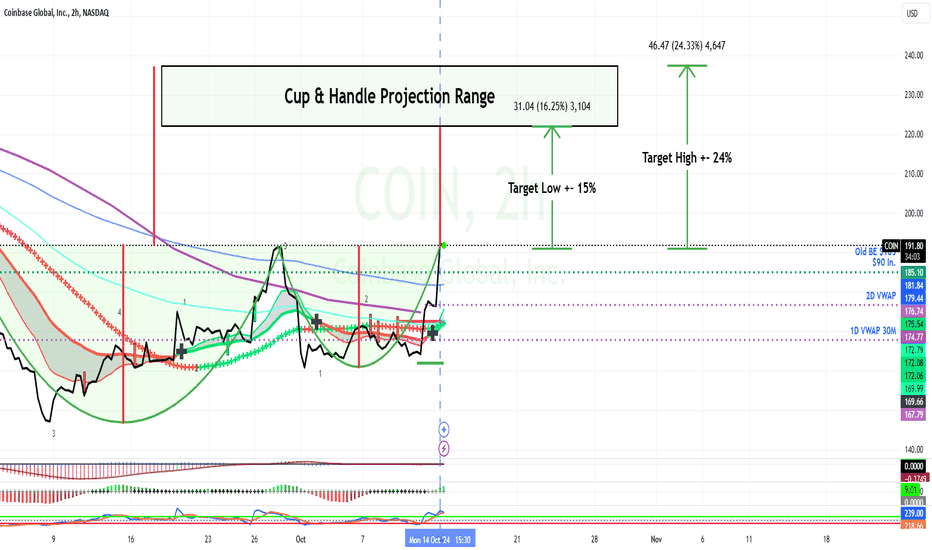
Coin Prints a Cup & Handle Pattern.Coin Base has now Printed a Cup and Handle Pattern which is Bullish.
This is following the Bullish Sentiment on Crypto Stocks of late.
I have Projected the Pattern to show Potential Targets.
As always, please get a few outside Expert's Advice before taking Trade or Investment Decisions.
Should you appreciate my Chart Studies, Smash That Rocket Boost Button. It's Just a Click away.
Regards Graham.
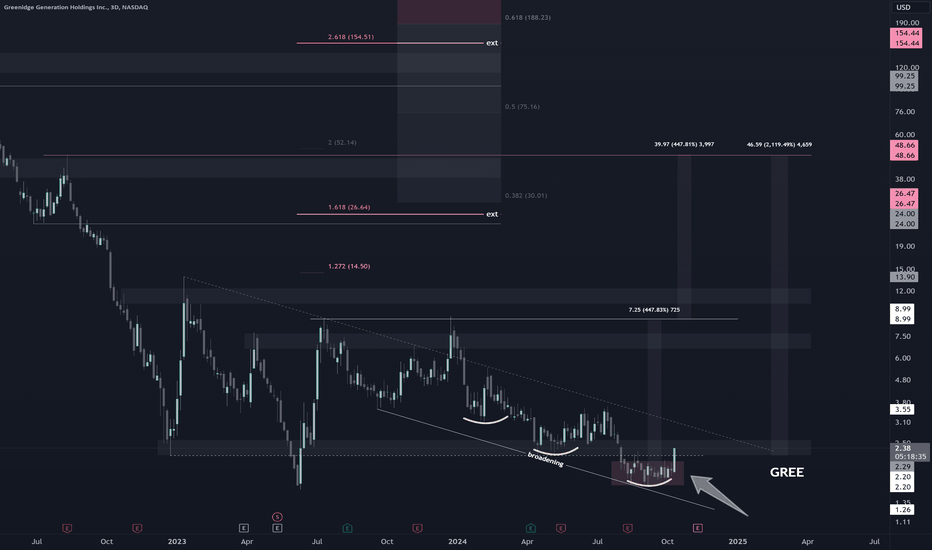
GREE - Right angled and Descending Broadening FormationReal nice look here on GREE, a bitcoin mining company. Breaking back thru the low of the range after 3 drives to alongside the lower trend.
Bullishly engulfing here on the 3day, first target being the range high at 8.99, then 14, 26, 50, going up the fib extension on the left side.
Measured move is 48.66
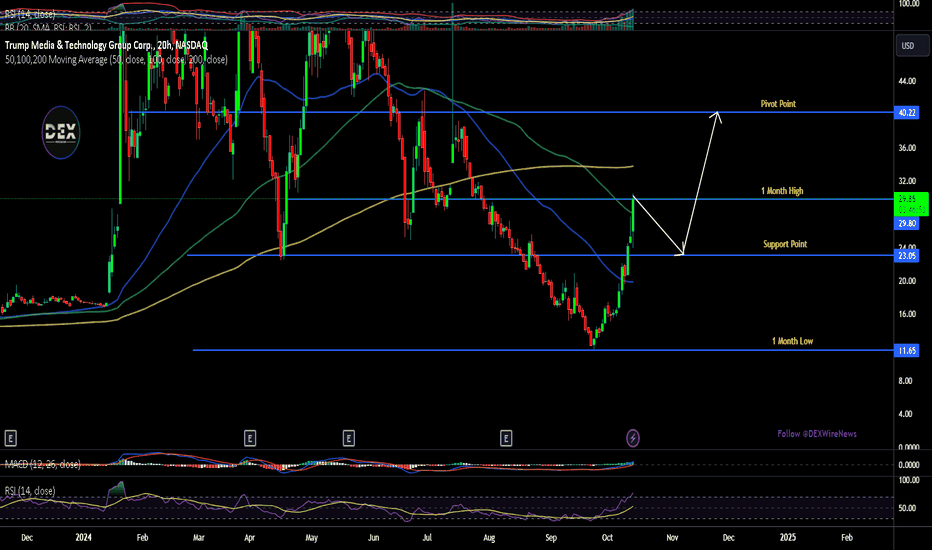
$DJT Climbs 18.55%—Boosting Trump’s Net Worth By Over $500 MlnShares of Trump Media & Technology Group (NASDAQ: NASDAQ:DJT ) surged by 18.55% on Monday, significantly increasing Donald Trump's net worth by over $500 million. This marks a notable rebound for the stock, which has faced volatility in recent months. Trump Media, which owns the social media platform Truth Social, saw its stock price rise to nearly $30 per share. Trump, who holds a 57% stake in the company, benefited from the sharp rise, bringing his net worth to $5.5 billion.
The surge in Trump Media stock comes as speculation around Trump’s potential election win intensifies. Betting markets have given Trump higher odds of winning, with Election Betting Odds trackers showing Trump leading Kamala Harris at 53.2% to 45.8%. The stock, often labeled a “meme stock,” has reacted strongly to these political developments.
Political Influence & Investor Sentiment
Trump Media’s stock price often mirrors the former president's chances in the upcoming U.S. election. As election betting markets sway in favor of Trump, so do investor sentiments surrounding $DJT. The rise in stock value can be largely attributed to Trump's increasing chances of a successful political comeback, leading investors to bet on the company’s future under a potential Trump presidency.
Additionally, the company's recent launch of Truth+ streaming services has contributed to the renewed attention. Trump Media (NASDAQ: NASDAQ:DJT ) recently announced the rollout of Truth+ on the web, with future plans to expand into iOS, Android, and major smart TV platforms. This move is expected to broaden the company’s user base and provide an additional revenue stream.
Technical Analysis:
From a technical perspective, (NASDAQ: NASDAQ:DJT ) is displaying strong bullish signals. As of the time of writing, the stock has formed a bullish engulfing pattern, confirming a potential continuation of upward momentum. The stock is currently trading above key moving averages, with the RSI sitting at an overbought level of 76. While the stock is in an overbought zone, this is a common feature for NASDAQ:DJT during sharp rallies, especially given the influence of political and media news on its price movement.
The stock's current resistance level is set at $40, a significant pivot that mirrors a previous support level from June 2024. Breaking through this resistance could lead to a new rally, especially if Trump's election prospects improve further. On the downside, support is positioned around $23, which is also near the stock’s one-month high. A move toward this zone would likely lead to consolidation before the next leg higher.
Election Impact on Long-Term Prospects
The outcome of the U.S. presidential election could have a dramatic effect on the future of NASDAQ:DJT stock. If Donald Trump emerges victorious, it is highly likely that the stock could test or exceed its all-time high (ATH) of $66, a level reached in February 2022. However, if Trump loses, the stock could face steep declines, with experts like Matthew Tuttle suggesting it could plummet to zero.
For now, Trump Media’s performance remains heavily influenced by external factors, particularly political events. Investors are advised to keep a close watch on polling data and election betting odds, as these will be critical in forecasting the stock's trajectory over the next several months.
What to Watch For
The next major catalyst for NASDAQ:DJT will be its third-quarter earnings report, expected in mid-November. The previous report showed lower-than-expected revenue, leading to a stock price drop. Investors will be watching closely to see if the company's new streaming platform and growing political momentum can offset earlier losses. If Trump’s political influence continues to rise, the stock could easily outperform expectations.
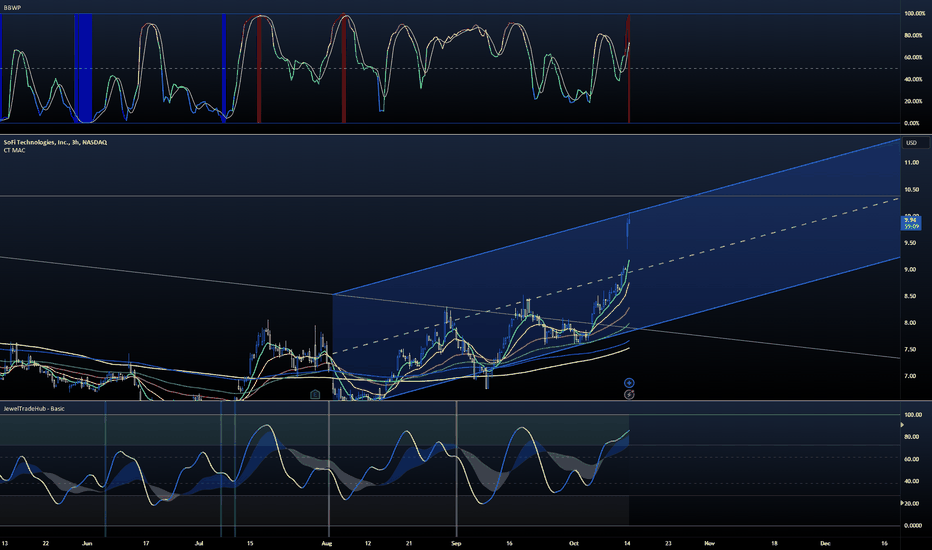
SCALP3H SCALP
While I advocate for a long term position for SOFI I believe in the short term it is probable for price action to see 9.62 again during this current market rally looking forward within the next few days max. The current high as of 10-14-K24 is 10.07 it's earning season so plenty of volatility is there to capture.
TIME FRAME OF EXECUTION
- 3HR
SOURCE OF EDGE
- Confluence with BBWP and Prop I
RISK MANAGEMENT PARAMETER
- Closure of above 10.22
POSITION ENTRY
- TRIPLEX
POSITION EXIT
- 50% AT 9.62
- 50% UPON INDICATOR REVERSAL
CAUTION
- CURRENT RALLY BREAK OUT OR RM TRIGGER
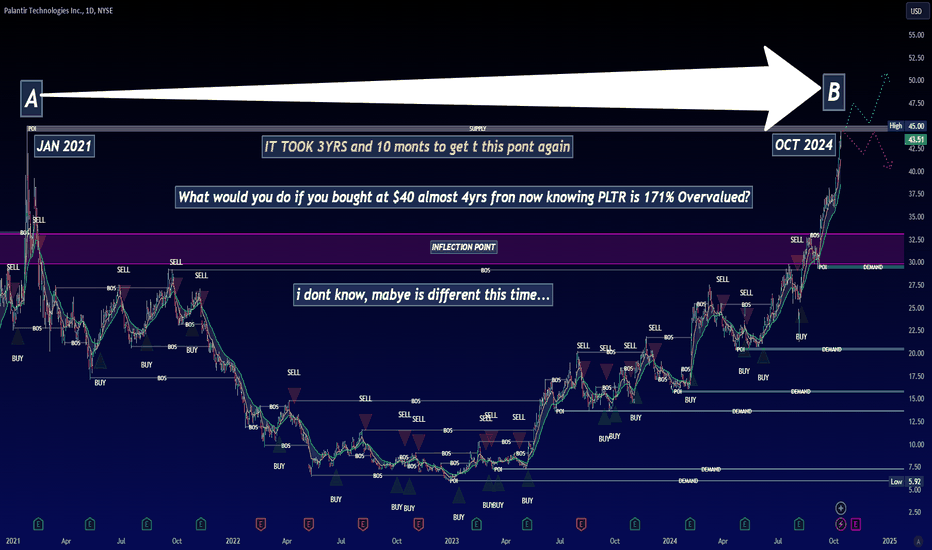
ANALIZING PALANTIR ITS JUST COMMON SENSE... BUT BE VERY CAREFULLLet’s welcome Palantir (PLTR) into the weekend analysis!
As we can see in the chart, today I wanted to do general structure analysis not too specific, as we are practically touching the highest level again in nearly 4 years.
Congratulations to all who bought at $12–16 per share and are still holding Palantir, but as I show in the chart, from point A to point B, it took almost 4 years to reach these levels again.
But here’s my question: WHAT WOULD YOU DO IF YOU BOUGHT AROUND $40 IN 2021?
I’d love to know, as this situation can greatly influence each person’s psychology when making a fundamental decision in trading.
(LEAVE YOUR OPINION IN THE COMMENTS)
I want you to know that I don’t just focus on price analysis. I also study company valuation. Based on a fundamental analysis of its balance sheet and recent moves by PLTR, I’ve concluded that Palantir is currently 171% above its intrinsic value.
In my personal opinion, my decision leans more toward common sense…
What do I mean?
1. Palantir is 171% overvalued.
2. Palantir is diluting its investors like crazy! In every quarterly report.
Do you know what dilution is?
Stock dilution can be harmful to shareholders because the value of each share is reduced, even though the investor holds the same number of shares. This is because the total value of the company doesn’t increase proportionally with the number of shares.
Palantir is an excellent company, although it’s a bit complicated to understand what they do and how they make money. But in my personal opinion, a company that dilutes its investors is nothing but a red flag to me—and a big red flag—because I call this the silent killer for investors.
At this point, PLTR is more on the hype side!
If Palantir reports well in November, we could see the stock above $50 per share, BUT if Palantir reports anything that doesn’t meet investor expectations, any data that falls short… Buckle up!
But how much could it fall? The truth is, I don’t know. But if we base it on technical analysis, I have an important inflection point (purple zone) where I expect the price to bounce after a sharp drop. BUT CAUTION! Only if Palantir doesn’t meet expectations.
An inflection point in trading refers to a critical moment on a price chart where the trend or price direction is expected to change. It marks the transition from one phase of price movement to another, often signaling a turning point in market sentiment or momentum. Traders pay close attention to inflection points as they may indicate a radical trend shift.
Traders use these points to adjust their strategies, such as entering or exiting positions, to capitalize on the expected change in price direction.
BUT WHAT WILL REALLY HAPPEN? I don’t know, maybe this time it will be different—who knows? But the only thing I can tell you is that numbers don’t lie, and neither does price action.
So, I hope the decision you make is the right one!
Thank you for supporting this analysis.
Sending you my best regards!
Tesla UpdateLast Friday price action pretty much went how I forecasted. I mentioned before the robotaxi event that inside investors were signaling price was about to head down. Of course, anything can happen with these things, but price action/structure dictated price head lower. The day after the event (market was closed during), price absolutely tanked and dropped almost 10% right into our target box for c of A.
From here we have a few different options on the table. The first thing that can transpire, is price chop around in this area with a downward bias toward the 1.618 fib extension @ $211.84. After this, minor B should start and bring us up to the $240's with a possible low $250's price point. The ALT to this, is we begin to head up from here. We moved below the 1.5 extension by $0.14 cents before raising slightly. In my experience, though, when in this circumstance if price breaches the 1.5, it usually has intentions of visiting the 1.618. Again, this isn't any rule, just the norm.
Either way, rather we make another low to the 1.618 or not, we should begin to raise again shortly towards the $240's for minor B. One thing to note, regardless on if we make another low or not, the larger 0.382 @ $248.85 falls in between the 0.618-0.786 retracement fibs of our minor wave A....so long as we don't extend lower past the 1.618 lol.
